POLIDATA ® APPORTIONMENT MAPS

US HOUSE, 1920 CENSUS (Congress never implemented this, 1910 apportionment used through 1930.)

POPULATION GROWTH, 1910 TO 1920
.
STATES GAINING/LOSING OVER 1910
8 gainers, 11 losers
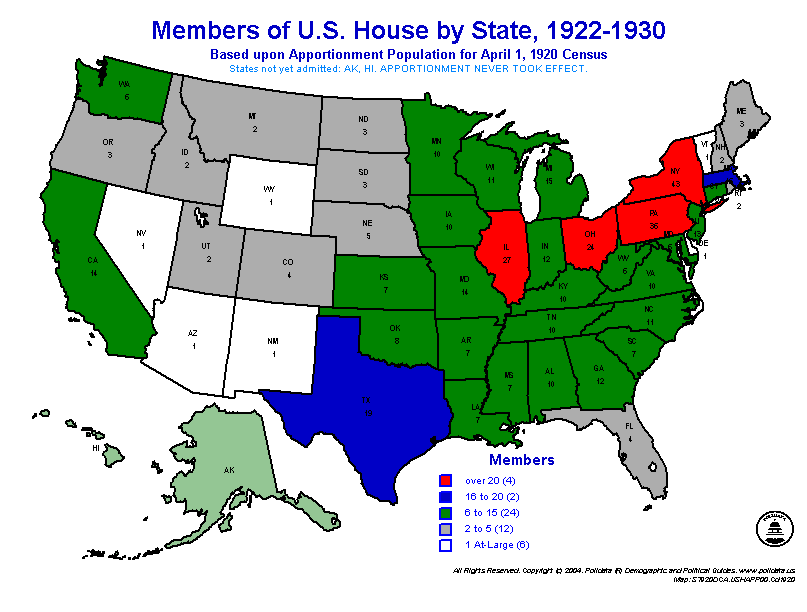
MEMBERS BY STATE, 1922-1930 (see note)
Congresses 68-72
ALMOST MADE IT
States below the 435 seat cutoff
OPTIONS FOR COLOR MAPS:
  1. LETTER: any one map on a sheet of letter-size 11x8.5 inch paper (landscape);
  2. TABLOID: any one map on a sheet of tabloid-size 17x11 inch paper (landscape);
  3. POSTER: maps 1+2 or 3+4 on one sheet of tabloid-size 11x17 inch paper (portrait);
  4. WALL-SIZE (C): any one map on two sheets of paper, tiled to be taped/glued together (includes county labels).


COPYRIGHT © 1994-2005, Clark H. Bensen. All Rights Reserved. POLIDATA ® Demographic & Political Guides


TEL: 703-690-4066 (8am-5pm ET) FAX: 202-318-0793 (24hrs.) EMAIL: info@polidata.org.
HOME: www.polidata.org. THIS: www.polidata.org/maps/mapsap70.htm
MAPS: www.polidata.org/maps. updated: 2004-oct-30